Measure what will last.
A universal index for cultural, data, and economic staying power.
Most metrics measure attention. TVI measures what survives.
Get the book drop + updates (no spam)
Which datasets become infrastructure?
Teams pick on downloads, stars, and recency → brittle models, benchmark chasing, silent dataset decay.
TVI shows whether a dataset is becoming a default — or being quietly replaced.
- MNIST vs CIFAR vs ImageNet — lower downloads, higher temporal persistence.
- Why some datasets survive 20+ years.
Example output generated using the BoonMind TVI engine.
Stop betting your company on fads.
Holacracy, OKRs, SAFe, Spotify get adopted because others did — not because they last.
TVI-B shows which frameworks compound and which decay after consulting hype.
- Agile vs Holacracy
- Lean vs Growth Hacking
- SMART vs OKRs — time exposes the difference.
Example output generated using the BoonMind TVI engine.
Momentum lies. Time doesn’t.
Markets price growth, buzz, and stories — not durability, category control, or crisis survival.
ISPS shows which companies are becoming foundations, not just riding cycles.
- Apple vs Nokia
- Amazon vs Pets.com
- Crypto cycles.
Example output generated using the BoonMind TVI engine.
Virality is cheap. Cultural memory is rare.
Impressions, reach, and clicks ignore what becomes canon vs what disappears.
TVI shows which ideas become reference points — and which fade.
- A 1990 song vs a TikTok hit.
- A meme that lasted vs one that didn’t.
Example output generated using the BoonMind TVI engine.
Important: Calculator outputs are illustrative and designed for pattern recognition and long-horizon comparison. They are not licensed for commercial decision-making, investment advice, or operational use. For commercial applications, evaluation access, or licensed deployment, please contact us below.
Viral Content
What TVI Is
TVI (Temporal Validation Index) is how you tell whether something will still matter after hype, cycles, and platform churn have burned away.
TVI is a proprietary analytical framework developed by BoonMind Analytics. Patent applications are in preparation. The public calculator and demonstrations are provided for educational and evaluation purposes only. Commercial use, licensing, and API access require separate agreements.
Problem: Modern metrics are inflated by platform size, algorithms, hype cycles, and short-term engagement. They miss longevity, reuse, cross-domain adoption, and historical embedding.
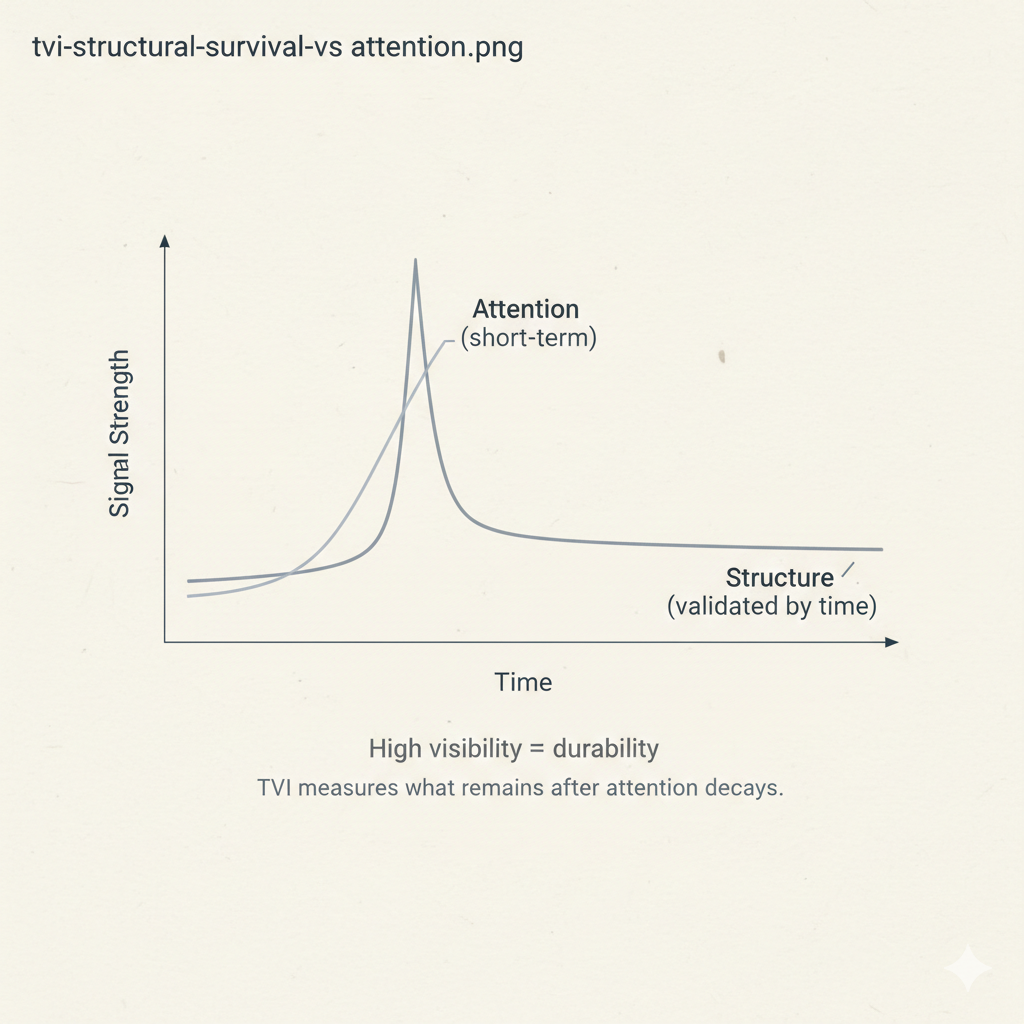
This chart contrasts short-term attention with long-term structural survival. Attention produces sharp but temporary spikes, while structurally validated signals persist after attention decays. TVI measures what remains once visibility fades.
TVI exists to answer one question: Is this real — or just temporarily loud?
What TVI Measures
- Contextual Saturation (CSI): How fully something occupied the attention space of its era (relative to what was possible). A-Factor (audience turnover) and C (cross-context escape) live here.
- Temporal Validation (TVS): Persistence × Resurfacing × Legacy. Time is the hardest critic; TVS measures its verdict.
- Structural Resistance (SRC): How hard it was to spread when it happened. Pre-algorithm eras were hostile; post-algorithm eras are jet fuel.
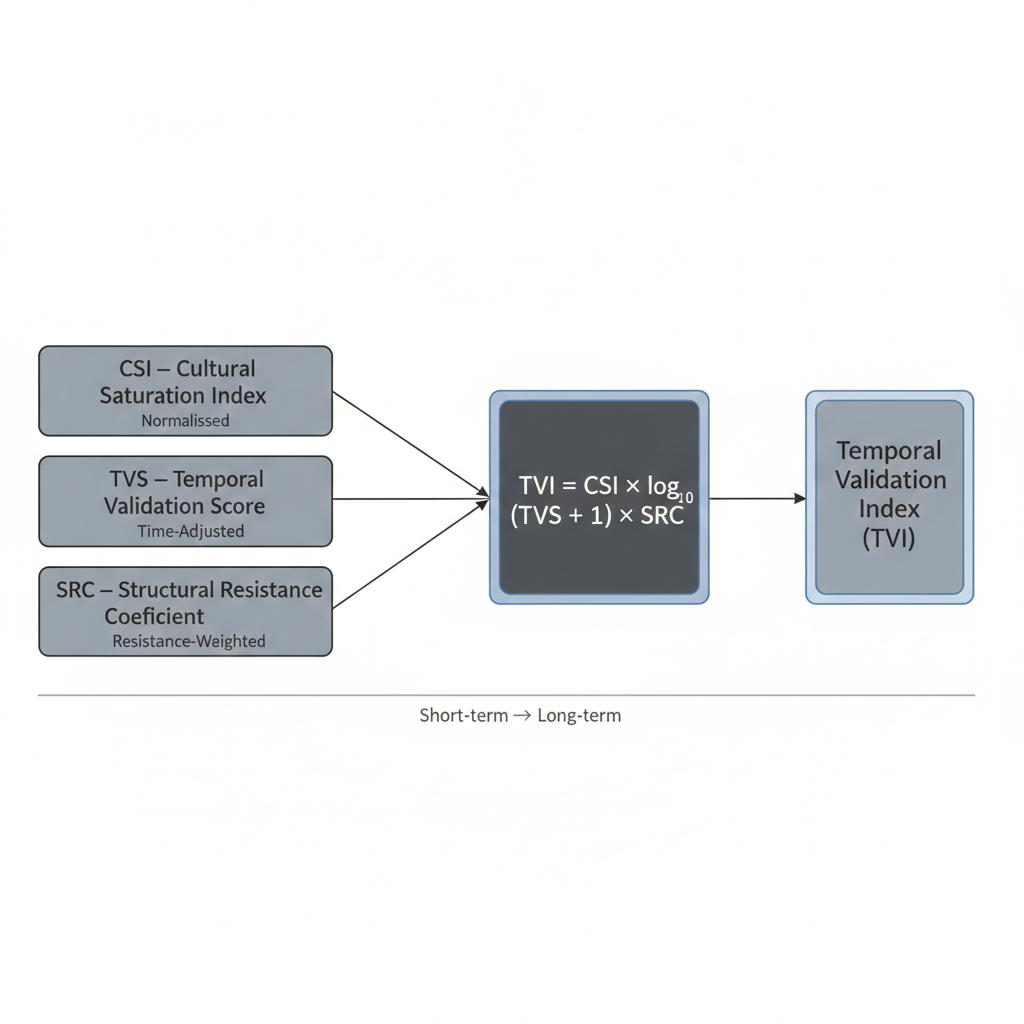
The Survival Equation: How Saturation, Temporal Validation, and Structural Resistance create a "Volume of Persistence."
This structure forces hype without time to collapse, scale without validation to decay, and proven survival to compound.
Why This Matters
TVI is a risk-reduction engine for high-stakes decisions in brand impact, long-term value measurement, cultural measurement, media valuation, and effectiveness over time:
- AI & Data: Filter datasets/benchmarks by time-robustness, not popularity.
- Governance & Policy: Separate real standards from policy theater.
- Business & Strategy: See which methods became infrastructure vs fads.
- Finance & Investment: Identify foundations, not trades — survival, crisis-resistance, dominance persistence.
- Brand & Marketing Analytics: Measure long-term cultural impact and media valuation beyond short-term engagement metrics.
Output: One number that answers "If we bet on this, will time be on our side?"—grounded in the only signal no one can fake: time.
What TVI Would Have Changed — In Numbers
The Breakdown
What Actually Happened (Documented, Public Record)
- SoftBank total exposure: ~$16B (2017–2019)
- Peak valuation: $47B (Aug 2019)
- Valuation after failed IPO: <$10B (Q4 2019)
Sources: SoftBank Vision Fund quarterly reports (2019–2020), WSJ, FT
The Damage (Actual Write-Downs)
- $14–15B written down (FY 2019–2020)
- ~75% value destruction
- Peak to collapse: 18 months (Jan 2018 → Aug 2019)
Math: $16B exposure - ~$2B recovered = ~$14B loss
With TVI (Conservative Counterfactual)
Assuming TVI flags structural fragility in 2017 and limits exposure:
- Initial exposure capped: $5–6B (not $16B)
- Capital not deployed: $10–11B (deferred pending multi-cycle validation)
- Loss at same 75% rate: ~$4–5B (vs. $14B)
- Net capital preserved: $8–10B ✓
Math: $14B actual loss - $4–5B hypothetical loss = $8–10B preserved
This is downside protection, not return enhancement.
Risk Pricing Delta
Risk Mispricing Under ROI:
ROI priced WeWork as a durable growth asset.
TVI Repricing Effect:
TVI would have applied:
- Higher discount rates
- Lower terminal value assumptions
- Capped exposure until multi-cycle validation
ROI-implied expected return: +5–6×
TVI-adjusted expected return: +1.5–2×
But with ~70% lower probability of catastrophic loss
What TVI Protects
| Risk Type | ROI Visibility | TVI Impact |
|---|---|---|
| Capital Overexposure | None | Exposure capped |
| Era Dependence | Ignored | Discounted |
| Structural Fragility | Invisible | Penalised |
| Downturn Sensitivity | Reactive | Pre-priced |
| Loss Severity | Unbounded | Bounded |
Downside reduction target for structurally fragile investments.
In large-scale allocation, that's billions preserved per fund.
ROI helps you maximise upside.
TVI helps you avoid $10B mistakes.
Commercial Use & Licensing
TVI operates across three access layers:
1. Public / Demonstrative
The calculator and sample outputs on this site are provided for educational and evaluation purposes. They demonstrate TVI's approach to temporal validation, pattern recognition, and long-horizon comparison. These outputs do not grant commercial usage rights.
2. Evaluation / Registered Access
For organizations evaluating TVI for internal use, brand impact measurement, media valuation, or cultural analytics, registered evaluation access provides expanded capabilities and documentation. This includes deeper pattern analysis, historical comparisons, and framework documentation.
3. Commercial / Licensed Use
Commercial licensing is required for: operational decision-making, investment analysis, client deliverables, API integration, white-label deployment, or any use where TVI scores inform business outcomes. Licensed access includes full formula access, custom domain configurations, API endpoints, and commercial usage rights.
When Is a License Required?
A TVI license is required when:
- TVI scores inform investment decisions, capital allocation, or portfolio management
- TVI analysis is included in client reports, deliverables, or advisory services
- TVI is integrated into internal analytics, dashboards, or decision-support systems
- TVI methodology is used for brand impact measurement, media valuation, or marketing analytics
- API access is needed for programmatic TVI calculation or bulk analysis
- White-label deployment is required for partner or client-facing applications
Who Is TVI For?
TVI is designed for:
- Investment firms and asset managers seeking downside protection and structural validation
- Brand and marketing analytics teams measuring long-term cultural impact and media effectiveness
- Media companies and content platforms evaluating long-term value and cultural measurement
- AI and data organizations assessing dataset durability and benchmark staying power
- Business strategy teams distinguishing infrastructure from fads in methodology adoption
- Research institutions and consultancies requiring validated temporal frameworks
Next Steps
Contact → Discuss your use case and evaluation needs
Evaluation → Access expanded capabilities and documentation
Licensing → Secure commercial usage rights and API access
Deployment → Integrate TVI into your analytics, advisory, or operational workflows
Evaluation materials available on request.
Framework Concepts
Deep visualizations of the TVI framework's core principles and applications.
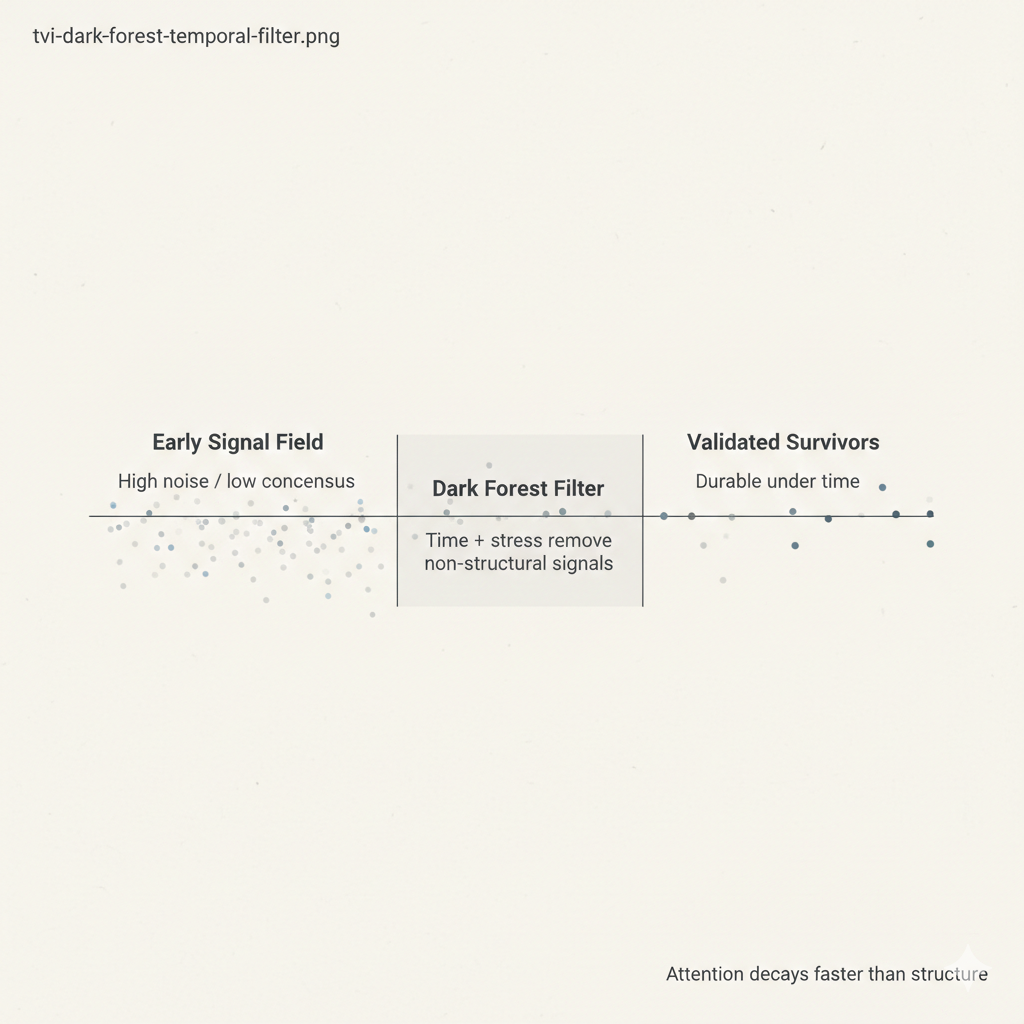
The Dark Forest Filter
Early signals enter a "dark forest" of temporal validation. Time and stress remove weak, non-structural signals. Only those with genuine durability survive the filter.
This diagram illustrates how early high-noise, low-consensus signals are filtered over time. The "Dark Forest Filter" represents temporal validation, where stress and duration eliminate non-structural signals, leaving only those that remain durable under real-world conditions.
Structural Viability After Stress
When a shock event occurs, systems with low structural resistance enter irreversible decline. High-resistance systems decline slowly and retain recovery potential. Time acts as a stress multiplier—the longer you survive under pressure, the more durable you prove to be.
Decay dynamics: Structural resistance determines whether you recover from crisis or collapse into it.
The Breakthrough (Crisis-Proof Infrastructure)
Once an entity achieves a certain TVI density, it becomes "Invulnerable." It is no longer a guest in the market; it is part of the infrastructure.
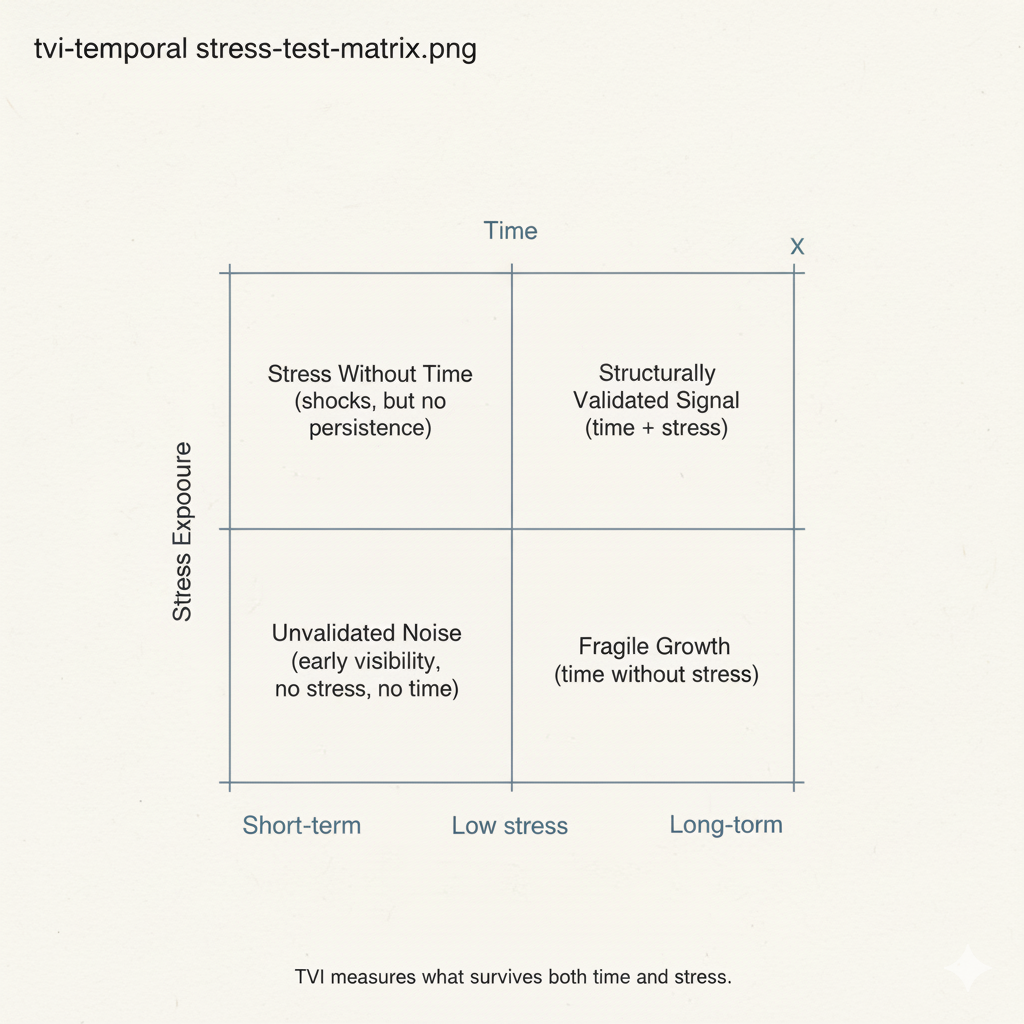
This matrix visualizes how signals behave under combinations of time and stress. Only signals exposed to both long-term duration and real stress achieve structural validation. TVI measures survival across both dimensions.
Attention vs. Temporal Persistence
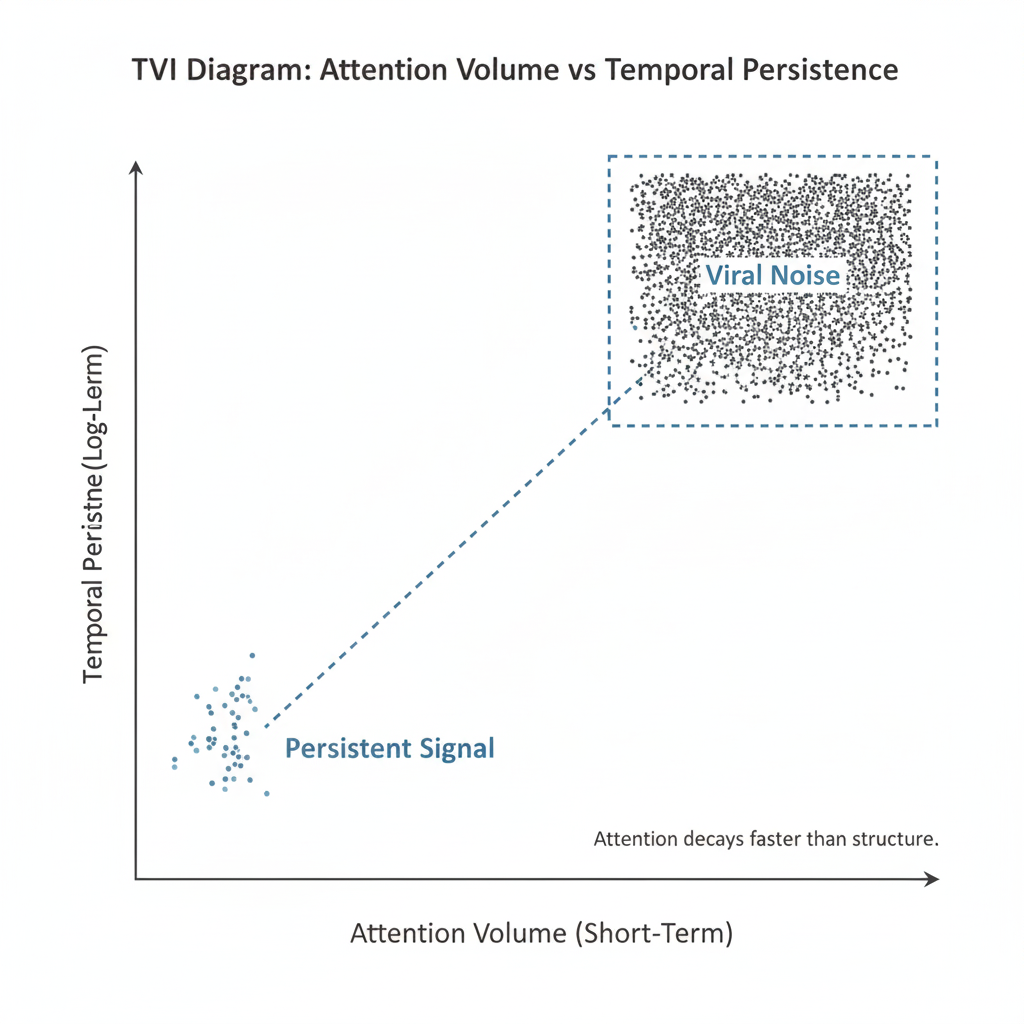
Most signals cluster in high-attention, low-persistence space—viral noise that burns bright and vanishes. A small subset achieves the opposite: lower initial attention, but high long-term persistence. TVI measures what remains after visibility fades.
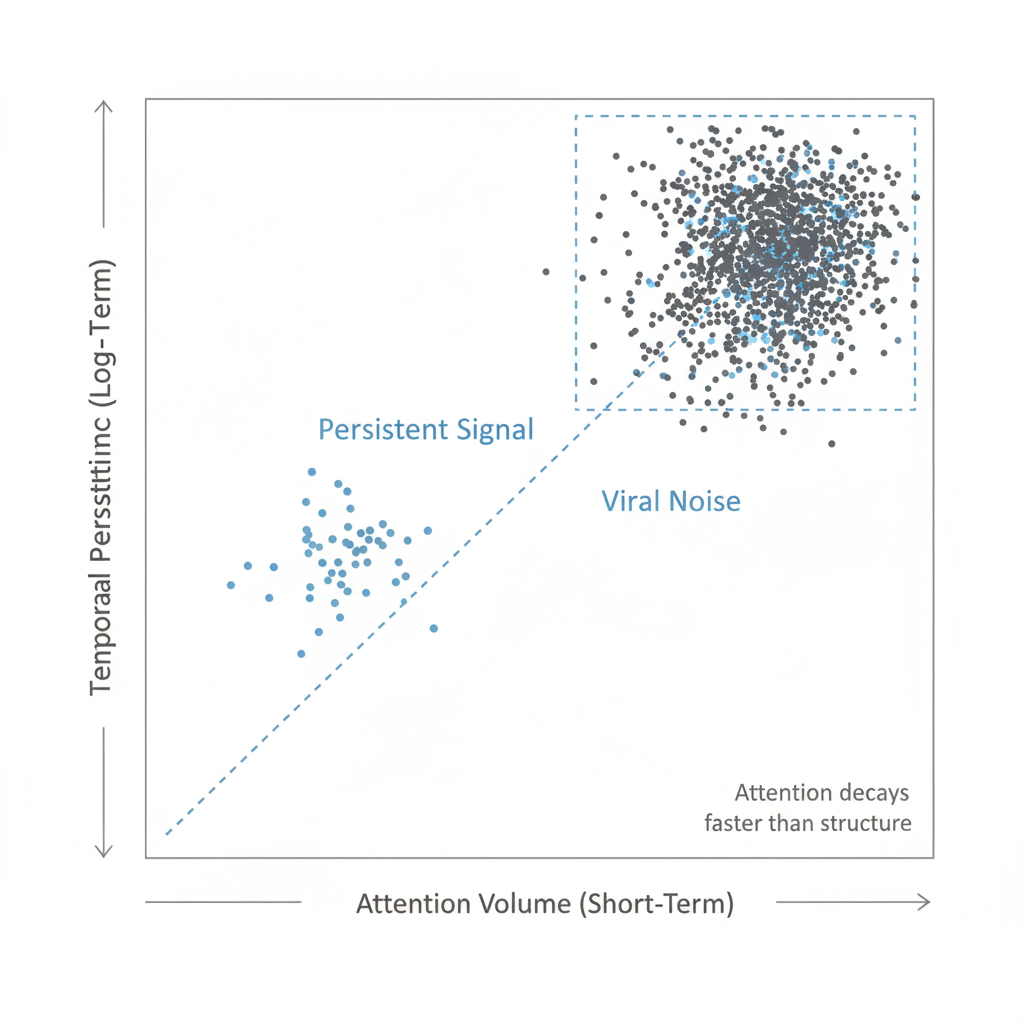
The dissonance: Virality is a 24-hour phenomenon. Cultural legacy is built on density, not volume.
Quick Compare
Select two items and see which has more staying power.